Figure 5.

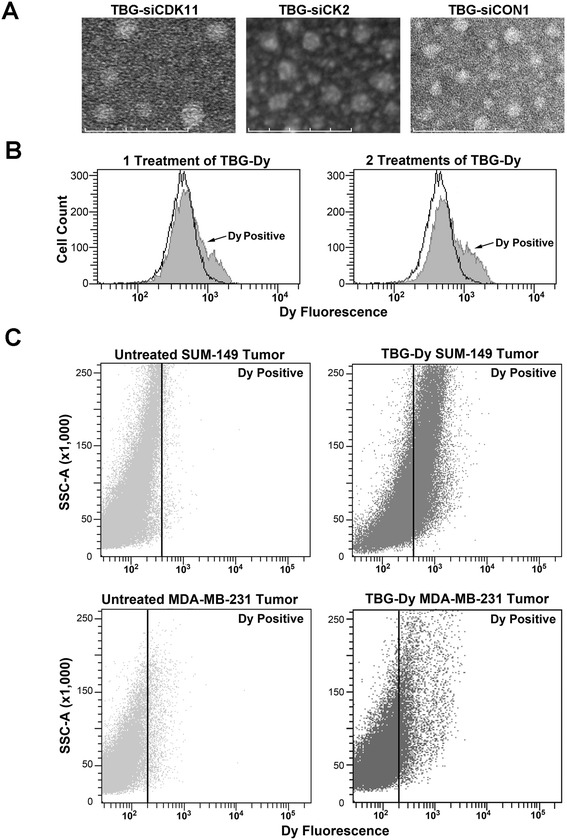
Nanocapsule morphology and uptake efficiency in cultured cells and in xenograft tumors. (A) Transmission electron micrographs of TBG-siCDK11, TBG-siCK2, and TBG-siCON1 nanocapsules used for in vivo studies. Scale bar: 100 nm. (B) MDA-MB-231 fluorescence-activated cell sorting (FACS) analysis for dysprosium (Dy) in untreated cells (black outline) and in TBG-Dy treated cells (gray). The number of TBG-Dy treatments is indicated above the graphs. (C) FACS analysis of xenograft tumor cells from untreated mouse (left panels) and from intravenous TBG-Dy-treated mouse (right panels). The identity of the tumor type is indicated above each panel. The position of the gate set to define Dy-positive cells is shown as a black line with Dy-positive events to the right of the line. CDK, cyclin-dependent kinase; CK2, casein kinase 2; si, small interfering; SSC, side scatter; TBG, tenfibgen.
