
Figure 7.
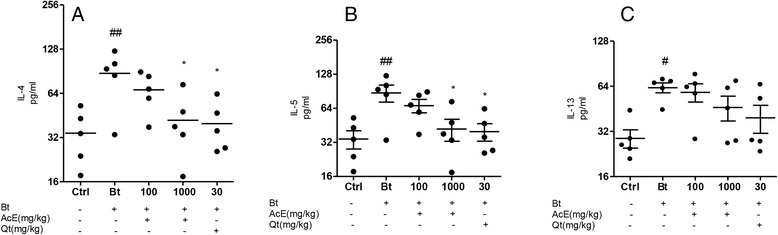
Effect of AcE or Qt on cytokine levels in BAL fluid. Effect of the treatment with AcE or Qt on the levels of A) IL-4 and B) IL-10 C) IL-13 in the BAL of Control (Ctrl); Bt-sensitized animals (Bt); and Bt-sensitized, AcE (100 or 1000 mg/kg) or Qt (30 mg/kg) treated mice. Values represent mean ± SEM (n = 5, per group). #p < 0.05 vs. control; ###p < 0.001 vs. control; **p < 0.01 vs. Bt group and ***p < 0.001 vs. Bt group (one-way ANOVA followed by Tukey’s test).