
Figure 8.
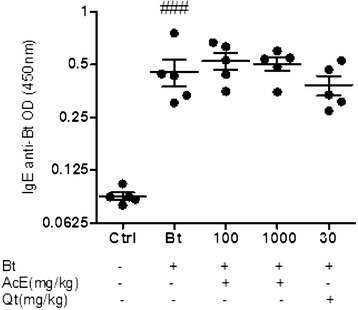
Effect of AcE or Qt on the levels of IgE anti-Bt. Effect of the treatment with AcE or Qt on the level of IgE in control (Ctrl); Bt-sensitized animals (Bt); and Bt-sensitized, AcE (100 or 1000 mg/kg) or Qt (30 mg/kg) treated mice. Antibody levels were measured by indirect ELISA. Values represent mean ± SEM (n = 5, per group). ###p < 0.001 vs. control (one-way ANOVA followed by Tukey’s test).