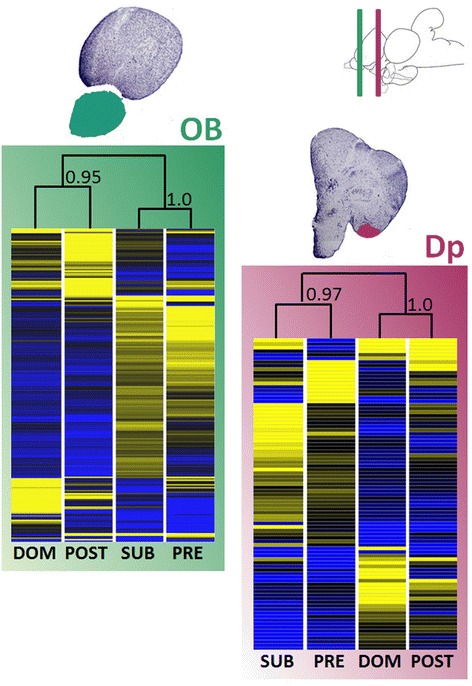
Figure 2.

Unsupervised hierarchical clustering of differentially expressed genes (p < 0.01) for all four olfactory stimuli and both brain areas sampled (OB and Dp). On the top right, a sagittal view of a tilapia’s brain cut by two lines (green and violet) representing the location of the coronal cuts depicted just below illustrating the areas sampled (OB and Dp; Nissl stained slices, 10 μm). Bootstrap values are shown on clustergrams. On the heatmaps, blue represents significantly down-regulated genes, yellow up-regulated genes and black intermediate levels of expression. Confidence values of cluster nodes were calculated using bootstrapping (1000 permutations with re-sampling). Olfactory stimuli used in this study: DOM- dominant male urine; SUB- subordinate male urine; PRE- pre-ovulatory female water extract; POST- post-ovulatory female water extract. Brain regions analyzed: olfactory bulb (OB), green box; posterior part of the dorsal telencephalon (Dp), purple box.
