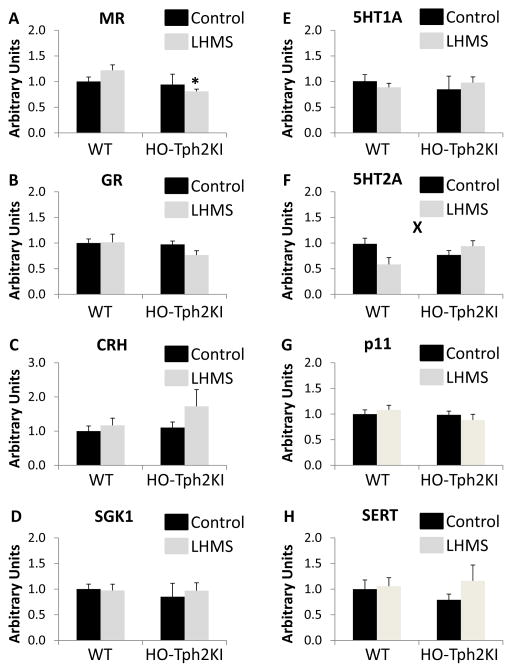
Figure 6.
The effects of LH/MS on gene expression in the hippocampus and amygdala. Quantification of real-time PCR data for MR (A), GR (B), CRH (C), 5-HT1a (D), 5-HT2a (E), p11 (F), and SERT (G) in the hippocampus. Quantification of real-time PCR data for MR (H), GR (I), CRH (J), 5-HT1a (K), 5-HT2a (L), p11 (M), and SERT (N) in the amygdala. N = 6–9 per group. * indicates p < 0.05 by Tukey’s post-hoc test compared to WT LH/MS. ** denotes significant main effect of genotype and ‘X’ denotes significant genotype by LH/MS interaction by two-way ANOVA (p < 0.05).

