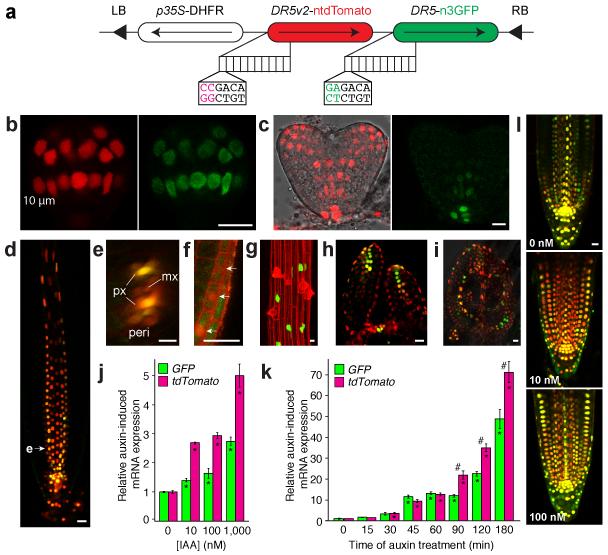
Figure 1. DR5v2 sensitively reports auxin response.
(a) Schematic of DR5v2-ntdTomato/DR5-n3GFP double reporter. 10 repeats of either reverse TGTCTC (DR5) or TGTCGG (DR5v2) are positioned upstream of a minimal promoter and either nuclear 3×eGFP (n3GFP) or nuclear tandem Tomato (ntdTomato). LB/RB, Left/Right Border; DHFR, Methotrexate resistance gene. (b-j) DR5v2 (red) and DR5 (Green) activity in early globular (b) and heart stage (c) embryos, root tip (d, longitudinal section; e, transverse section along plane at arrowhead in d; px, protoxylem; mx, metaxylem; peri, pericycle), lateral root cap (f), root epidermis (g, here shown in a DR5v2::n3eGFP root), SAM (h) and young leaf (i). (j,k) Relative qRT-PCR GFP and tdTomato transcript level in DR5v2-ntdTomato/DR5-n3GFP seedlings after 12 hour pre-treatment with 10 μM NPA followed by 2 hour treatment with auxin (IAA) concentrations as indicated (j), or treated with 1 μM IAA for the indicated times without NPA pre-treatment (k). Expression in mock treatments in are set to 1. Bars indicate standard error from the mean (n= 3). Asterisks (*) indicate significantly different expression compared to untreated control, while number signs (#) indicate significant difference between DR5 and DR5v2 (Two-tailed t-test; p<0.05). (l) Visualization of DR5v2 (red)-DR5 (Green) double reporter activity in root tips after 12-hour co-treatment of 10 μM NPA with indicated IAA concentrations. Scale bar in panels (b-i, l) is 10 μm.

