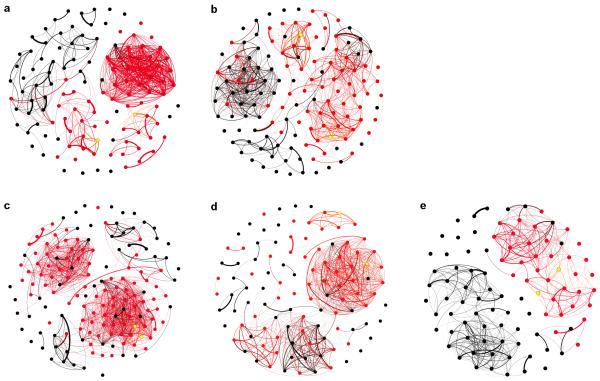
Extended Data Fig. 3. Social Networks showing diffusion of innovation.
Red nodes are individuals that acquired the novel behaviour after 20 days of exposure, black nodes are naïve individuals and yellow nodes are trained demonstrators. Networks are heavily thresholded to only show links above the average edge strength for each replicate (T1-5: 0.09, 0.05, 0.08 0.07, 0.07). a, Social network for T1 replicate (n=123). b, Network for T2 replicate (n=137). c, Network for T3 replicate (n=154). d, Network for T4 replicate (n=95). e, Network for T5 replicate (n=110).

