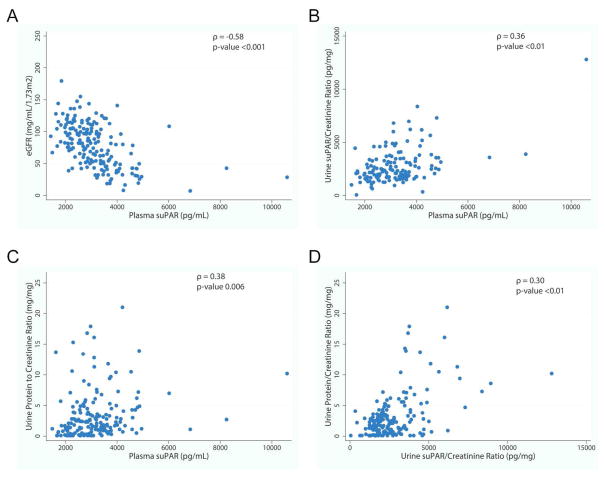
Figure 3. Correlates of Baseline Plasma and Urine suPAR.
A) Plasma suPAR (pg/mL) concentration was negatively correlated with eGFR (ρ = −0.58, p-value <0.001). B) Urine suPAR/creatinine ratio and plasma suPAR concentrations were positively correlated (ρ = 0.36, p-value <0.01). C) Plasma suPAR (pg/mL) was positively correlated with UPCR (ρ = 0.38, p-value 0.006). D) Urine suPAR/creatinine ratio (pg/mg) was positively correlated with urine protein/creatinine ratio (mg/mg) (ρ = 0.30, p-value <0.01).

