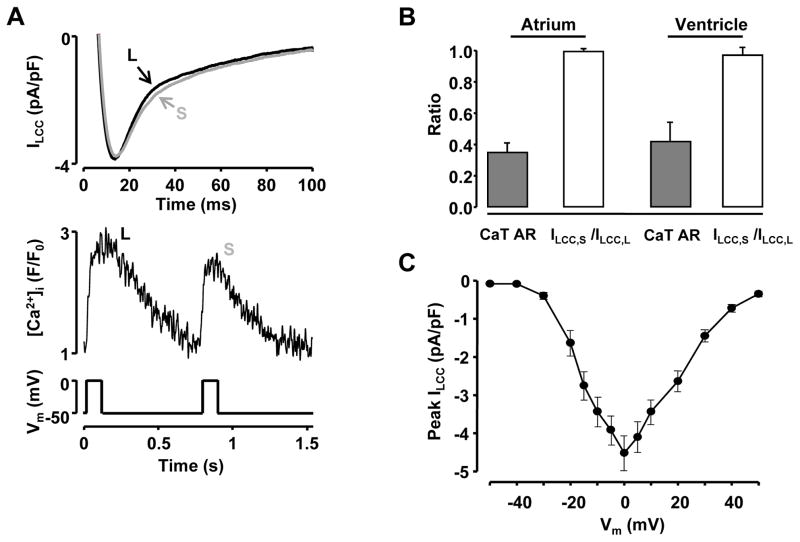
Figure 5. Simultaneous recordings of L-type Ca2+ current and CaT alternans.
A: Simultaneous recordings of ILCC and CaTs from a voltage-clamped ventricular myocyte during CaT alternans. ILCC was elicited with 100 ms depolarization steps from a holding potential of -50 mV to 0 mV (bottom). S: small amplitude CaT; L: large amplitude CaT. B: Summary data for simultaneously recorded ILCC,S/ILCC,L ratios and CaT AR in atrial (n=4) and ventricular (n=5) myocytes. ILCC,S: peak L-type Ca2+ current recorded with small amplitude Ca2+ transient; ILCC,L: peak current recorded simultaneously with large CaT. C: Current-voltage relationship of ILCC recorded from ventricular myocytes (n=9).

