
Figure 2. CREB negatively regulates ADAR1 expression.
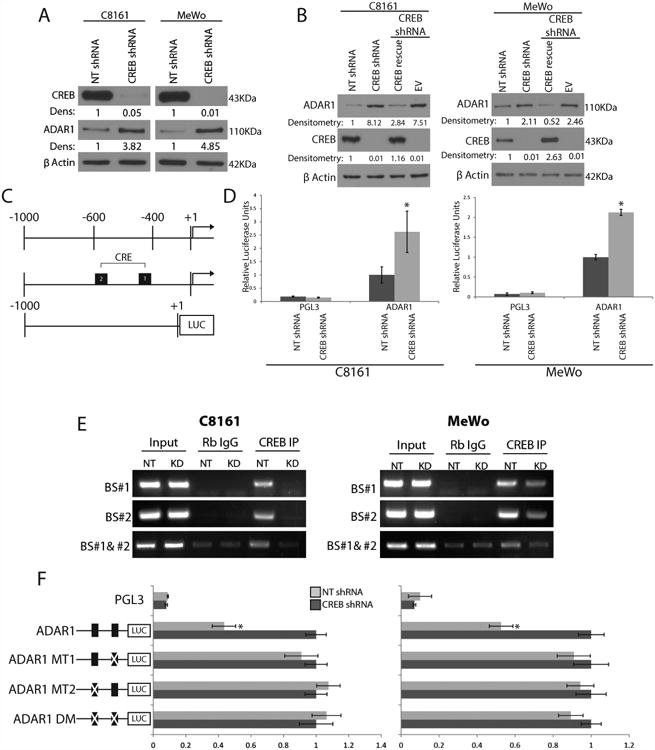
(A) Western blot analysis of shRNA CREB-transduced C8161 and MeWo cells show a 3-5 fold increase in ADAR1 expression as compared to NT shRNA controls (data are representative 3, biologically independent experiments). (B) Rescue of CREB expression in the CREB- silenced cells results in downregulation of ADAR1 expression in both C8161 and MeWo cells (data are representative of 3 biologically independent experiments). (C) Schematic representation of the ADAR1 promoter region fused to the luciferase reporter gene and its predicted CRE binding sites. (D) ADAR1 promoter driven luciferase expression increased by 2 fold after CREB silencing as compared to NT control, *p<0.01 (n=3 biologically independent samples per group, statistical significance was determined by two-tailed Student t-test; error bars represent s.d.). (E) CHIP analyses showed no binding of CREB to the ADAR1 promoter at either CRE binding site after CREB silencing in either C8161 or MeWo cell lines. IgG antibodies were used as negative controls. Input DNA was used as a loading control (data are representative of 3, biologically independent experiments). Statistical significance was determined by two- tailed Student t-test. (F) Schematic representation of the ADAR1 promoter point mutations is depicted left of the panel. Luciferase activity driven by the ADAR1 promoter increased in the NT shRNA group when mutations were made at either or both of the CRE binding sites, *p<0.01 (n=3 biologically independent samples per group, statistical significance was determined by two-tailed Student t-test; error bars represent s.d.). Uncropped images of blots and gels are shown in Supplementary Figure 8.