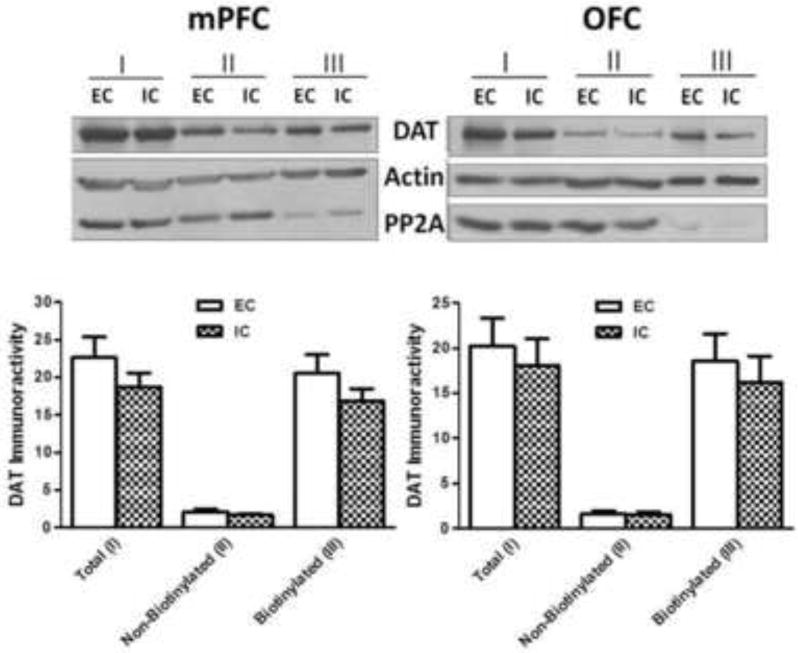
Fig. 2. Environmental enrichment does not alter DAT immunoreactivity in total (I), non-biotinylated (II, intracellular) or biotinylated (III, cell surface) fractions from mPFC (left panel) or OFC (right panel).

Subcellular fractions of mPFC and OFC from EC and IC rats were assayed using biotinylation and immunoblotting. Top panels show representative immunoblots of DAT expression from mPFC and OFC of EC and IC rats. Immunoreactive bands were within the linear range of detection. Bottom panels show mean ± SEM densitometry values for DAT immunoreactivity. β-Actin was used to monitor protein loading. Both mPFC and OFC were obtained from individual rats within the EC and IC conditions. For EC and IC groups, n = 8 rats for mPFC and OFC.
