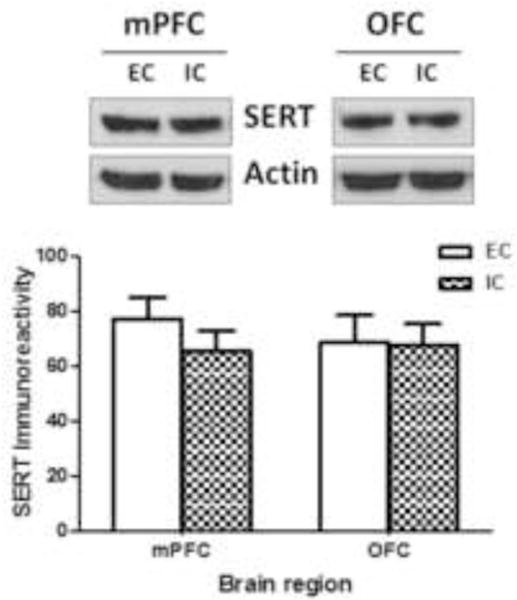
Fig 4. Environmental enrichment did not alter SERT immunoreactivity in mPFC or OFC from EC and IC rats.

Top panel shows representative immunoblots of SERT expression in mPFC and OFC from EC and IC groups. Immunoreactive bands were within the linear range of detection. Bottom panel shows mean ± SEM of densitometry values for SERT immunoreactivity. β-Actin was used to monitor protein loading. Both mPFC and OFC were obtained from individual rats within the EC and IC conditions. For EC and IC groups, n = 8 rats for mPFC and OFC.
