
Figure 2.
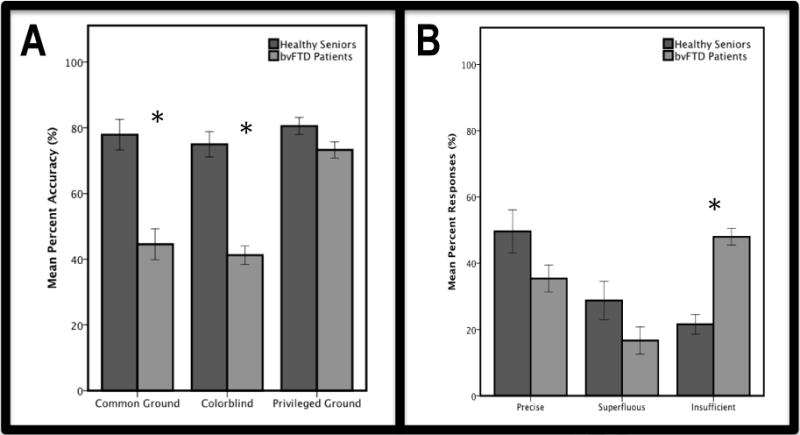
Panel A: Mean (±SEM) percent accuracy of responses in common ground, colorblind, and privileged ground conditions for healthy seniors (blue) and bvFTD patients (green). bvFTD patients performed significantly worse than healthy controls on common ground and colorblind trials, but not on privileged ground trials. Panel B: Mean (±SEM) percent responses classified as precise, superfluous, and insufficient for healthy seniors (blue) and bvFTD patients (green). bvFTD patients provide significantly more insufficient responses than healthy seniors.