
Figure 4.
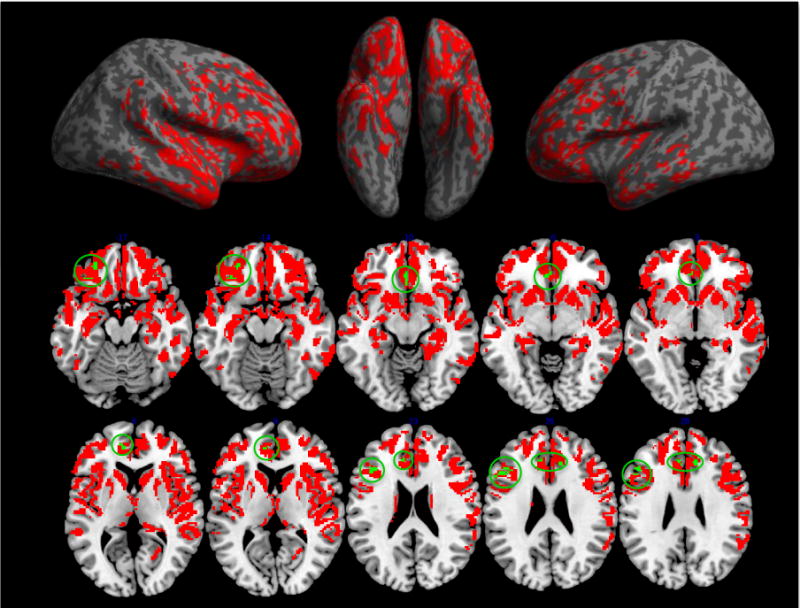
Panel A. Surface renderings depicting regions of significantly reduced GM density in bvFTD patients relative to healthy seniors. Panel B. Regions of significantly reduced GM density in bvFTD patients relative to healthy seniors (all colored areas) and regions of significantly reduced GM density associated with impaired social coordination (accuracy score across all trials) in bvFTD patients (green areas, circled).