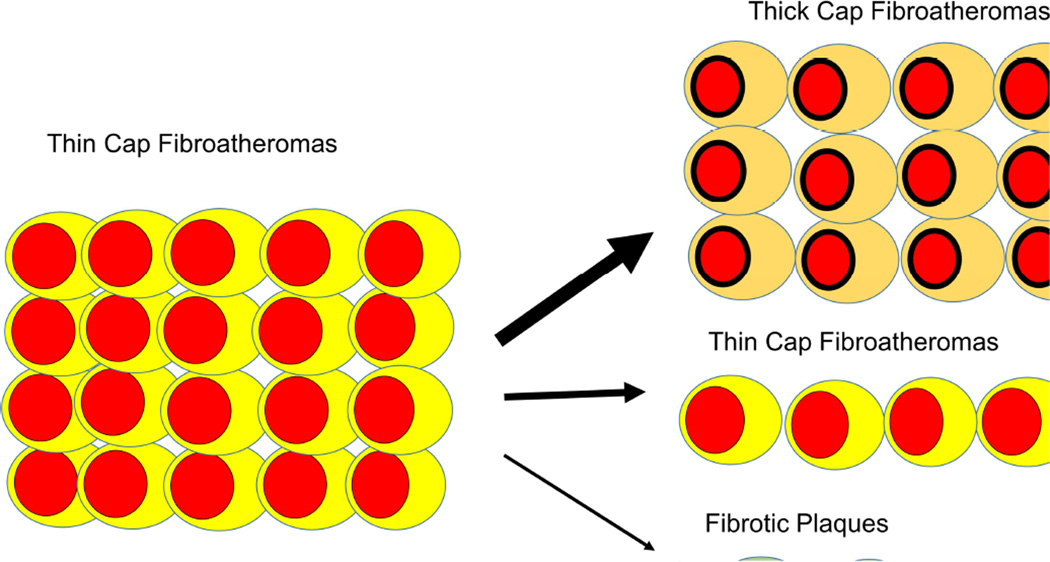
Figure 2. Changes in TCFAs During 12 Months Follow-Up.
Changes in TFCAs observed with virtual histology intravascular ultrasound 12 months after baseline imaging. Of 20 TFCAs, only 5 remained unchanged while 15 (75%) lost vulnerable characteristics and revealed thickening of the fibrous cap or transformed into fibrous plaques. The data (Kubo et al. (43)) demonstrate high metabolic activity in atherosclerotic lesions and the short-lived nature of vulnerable plaque characteristics. None of the 99 patients experienced any events during follow up; thus many of the observed changes were likely the result of subclinical plaque ruptures. Abbreviations as in Figure 1.

