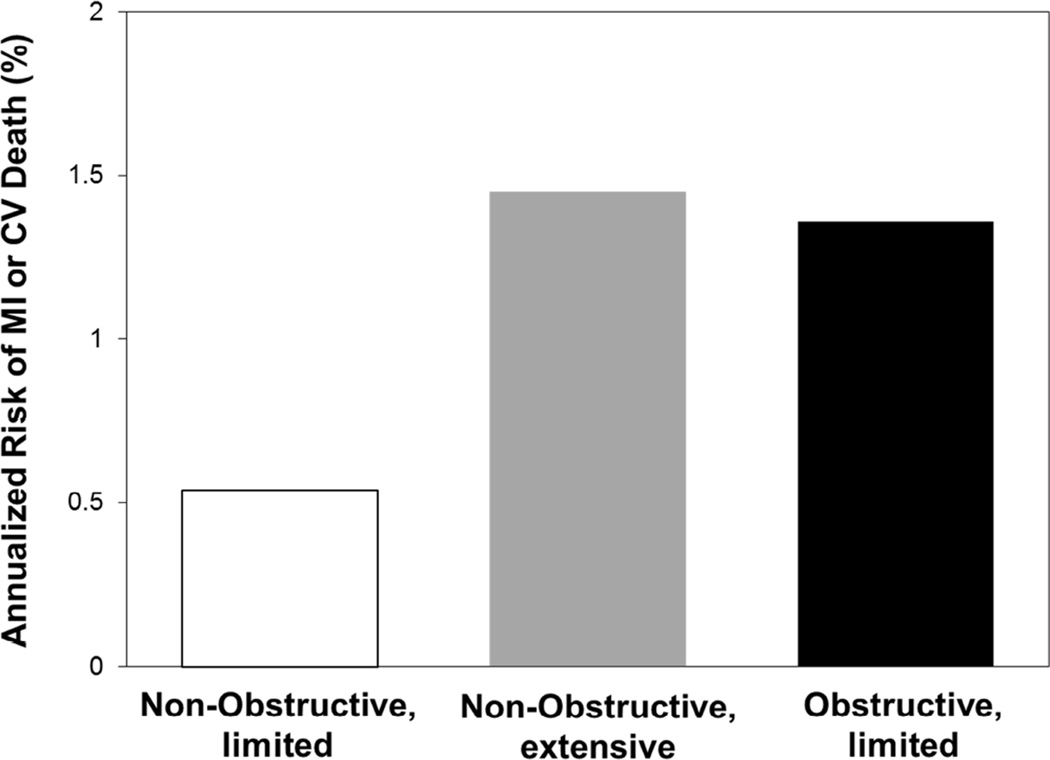
Figure 3. Risk from Non-Obstructive Versus Obstructive Coronary Artery Disease.
Annualized risk (%) of MI or CV death in 3,242 patients followed for a median of 3.6 years after a baseline CT coronary angiogram, according to the extent and severity of coronary artery disease (70). Risk is low in patients with nonobstructive disease (<50% stenosis) involving 4 or fewer coronary artery segments (limited disease). Conversely, the risk is similarly high in patients with nonobstructive disease if more than 4 segments are affected (extensive disease) compared to patients with obstructive disease (≥50% stenosis). Modified from Bittencourt et al. (70). CT = computed tomography. Other abbreviations as in Figure 1.

