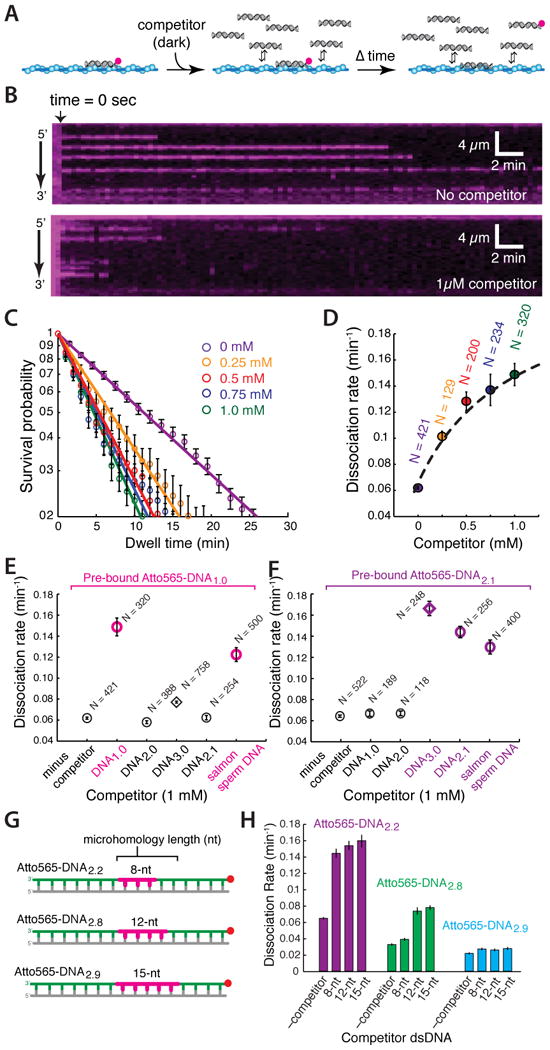
Figure 5. Facilitated exchange of captured intermediates.

(A) Strategy for quantifying dsDNA dissociation after injection of unlabeled competing DNA. (B) Kymographs showing the dissociation of Atto565-DNA1.0 from the Rad51 PC in the absence (upper panel) and presence (lower panel) of unlabeled competitor DNA1.0. (C) Dwell time analysis of dissociation kinetics and (D) dissociation rates for Atto565-DNA1.0 when chased with varying concentrations of dark DNA1.0. The dissociation rates as a function of dark competitor are fit to a Hill-type curve with an intercept conveying the reaction in the absence of competitor. Dissociation rates for (E) Atto565-DNA1.0 and (F) Atto565-DNA2.1 when challenged with different competitor substrates (1 μM each), as indicated; like colors correspond to competitors bearing overlapping tracts of microhomology, competitors lacking overlapping microhomology are shown in black. (G) Schematic and (H) corresponding data for substrates used to test the influence of microhomology length and alignment on facilitated exchange. For (D-F), N corresponds to the number of Atto565-DNA molecules measured, and error bars are S.D.
