
Figure 1.
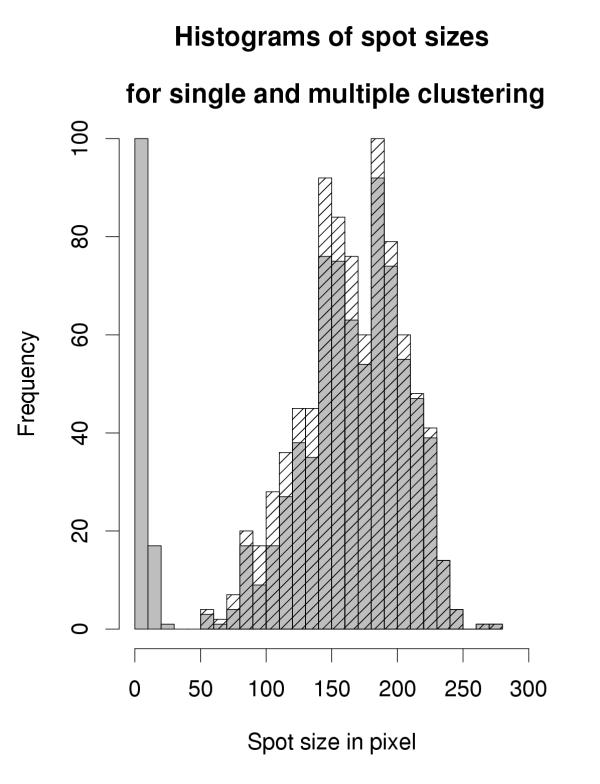
Distribution of spot sizes. Distribution of foreground area sizes after single clustering (grey) and after repeated clustering (shaded), applied to a microarray slide with 864 spots.
Official websites use .gov
A
.gov website belongs to an official
government organization in the United States.
Secure .gov websites use HTTPS
A lock (
) or https:// means you've safely
connected to the .gov website. Share sensitive
information only on official, secure websites.
Distribution of spot sizes. Distribution of foreground area sizes after single clustering (grey) and after repeated clustering (shaded), applied to a microarray slide with 864 spots.