
Figure 10.
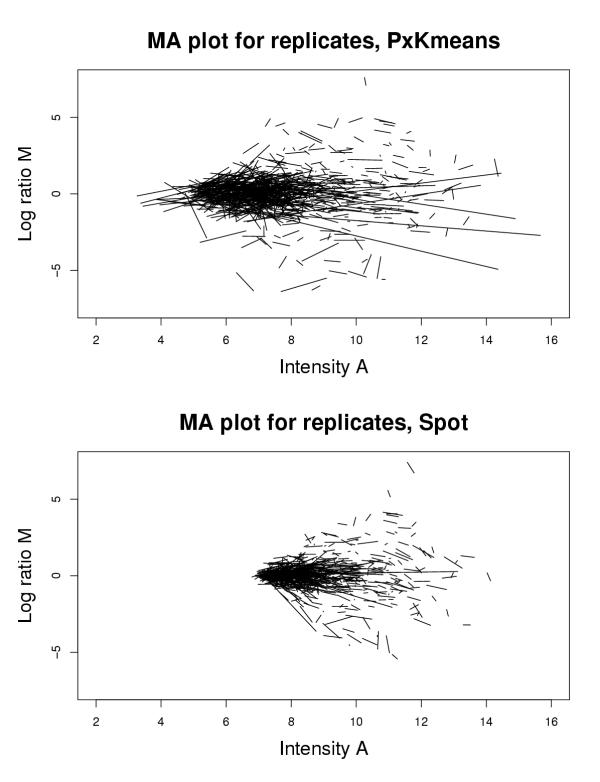
MA plots. MA plots for HYBRID PXKMEANS (top) and Spot (bottom), measurements of two replicates are connected by lines. In both plots, for every spot the mean of the measurements for red and green intensity is plotted against their ratio, on a log2-scale.