
Figure 11.
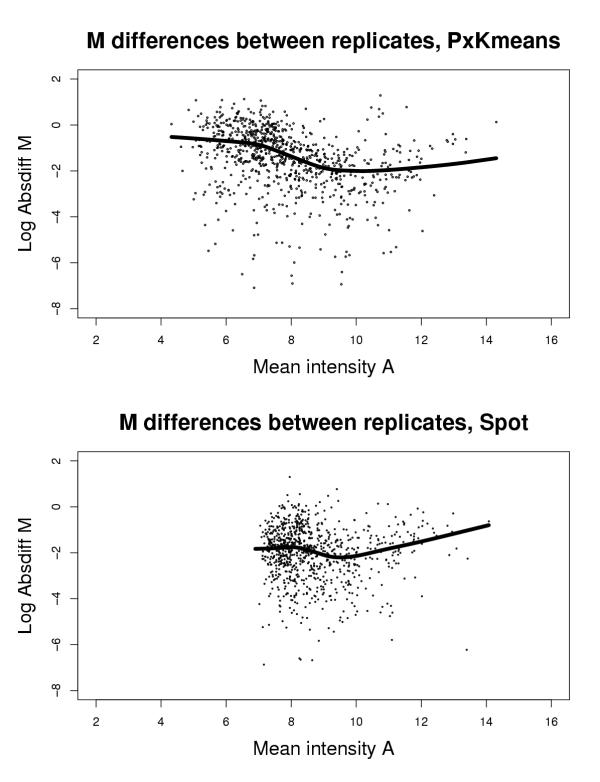
Comparative plot for differences of M values for repeated measurements. Plot of mean intensities against absolute differences of log-ratios between two replicates, on a log2-scale.
Official websites use .gov
A
.gov website belongs to an official
government organization in the United States.
Secure .gov websites use HTTPS
A lock (
) or https:// means you've safely
connected to the .gov website. Share sensitive
information only on official, secure websites.
Comparative plot for differences of M values for repeated measurements. Plot of mean intensities against absolute differences of log-ratios between two replicates, on a log2-scale.