
Figure 5.
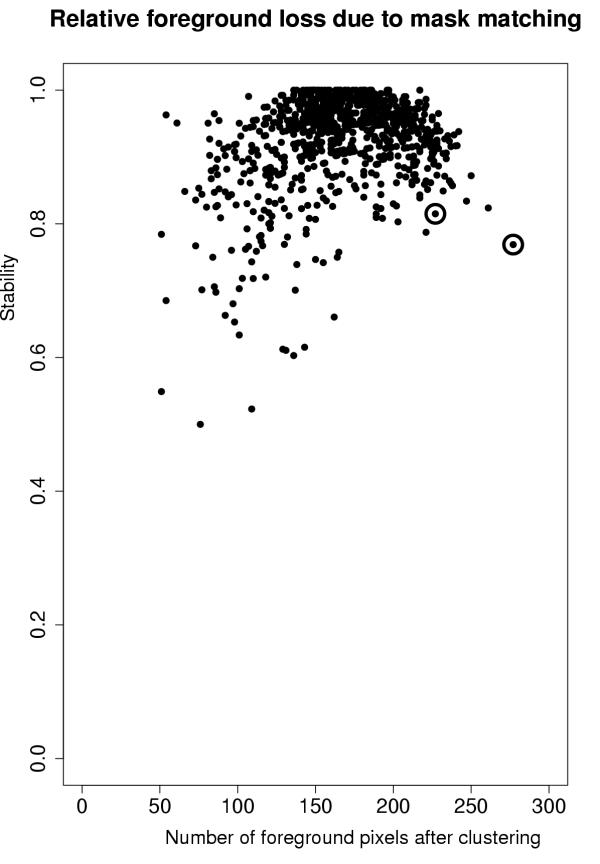
Distribution of 'stability' values. 'Stability' values for a microarray with 864 spots. For every spot, the foreground area size is plotted against the 'stability'. The points that belong to spots 402 and 788 are encircled.
Official websites use .gov
A
.gov website belongs to an official
government organization in the United States.
Secure .gov websites use HTTPS
A lock (
) or https:// means you've safely
connected to the .gov website. Share sensitive
information only on official, secure websites.
Distribution of 'stability' values. 'Stability' values for a microarray with 864 spots. For every spot, the foreground area size is plotted against the 'stability'. The points that belong to spots 402 and 788 are encircled.