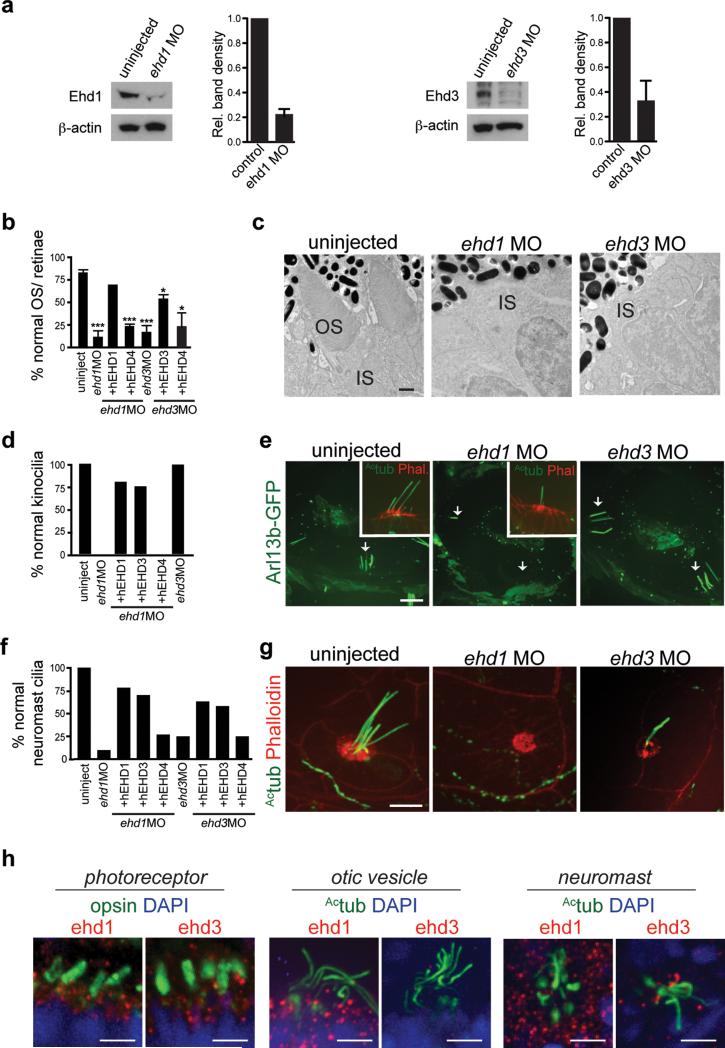
Figure 2. ehd1 and ehd3 regulate ciliogenesis in zebrafish.
a. Western analysis and quantification of Ehd1 and Ehd3 protein expression in 3 dpf MO injected embryos. Mean ± SEM from n=3 independent experiments (lysates with 50 embryos per condition) is shown.
b. Quantification of photoreceptor OS number from histological sections of 3 dpf retinae stained with toluidin blue. Mean ± SEM from n=3 independent experiments is shown (>100 photoreceptors per condition). ehd1 MO+EHD1 from n=2 independent experiments (>100 photoreceptors), Two-tailed t-test analysis compared with uninjected.
c. Representative electron micrographs from n=3 independent experiments (1-2 fish per condition) showing two photoreceptor cells in control, ehd1 and ehd3 morphants at 3 dpf. OS: outer segment, IS: inner segment. Scale bar: 500nm.
d. Quantification of otic vesicles with kinocilia in 2 dpf Tg(arl13b-GFP) embryos uninjected or injected with ehd1 or ehd3 MO. uninjected, n=18; ehd1MO, n=13; ehd1MO+ hEHD1, n=6; ehd1MO+ hEHD3, n=4; ehd1MO+ hEHD4, n=5; ehd3MO, n=10.
e. Representative images of otic vesicles described in (d) with insets showing sensory patches fixed and stained with anti-Actub antibody and phalloidin. Note that ehd1 morphants lack kinocilia. Scale bar: 10 μm.
f. Quantification as in (d) of neuromasts with normal cilia in 2 dpf embryos stained with Actub and phalloidin antibodies. Uninjected, n=20; ehd1MO, n=10; ehd1MO+ hEHD1, n=23; ehd1MO+ hEHD3, n=27; ehd1MO+ hEHD4, n=22; ehd3MO, n=16; ehd3MO+ hEHD3, n=41; ehd3MO+ hEHD1, n=12; ehd3MO+ hEHD4, n=16. Note that ehd3 morphants present a partial phenotype with reduced number of kinocilia (quantification in Supplemental Fig 2b). Pooled data across 3 independent experiments is shown in (d) and (f).
g. Representative images of neuromasts as described in (f). Scale bar: 10 μm.
h. Representative images of photoreceptors in retinae of 3 dpf embryos, anterior cristae of otic vesicles and neuromasts stained with anti-Ehd1 or anti-Ehd3 and anti-rhodopsin or anti-Actub antibodies showing punctate accumulation of proteins in the cytosol and around the base of cilia in these organelles. Organs were imaged with the same fluorescence microscopy settings, which show that Ehd3 levels were low in the otic vesicles. Scale bar: 10 μm.
Un-cropped images of blots are shown in Supplementary Fig 6. *P<0.05, *** P<0.0001.
Statistics source data for Fig 2 a,b found in Supplementary Table 2.

