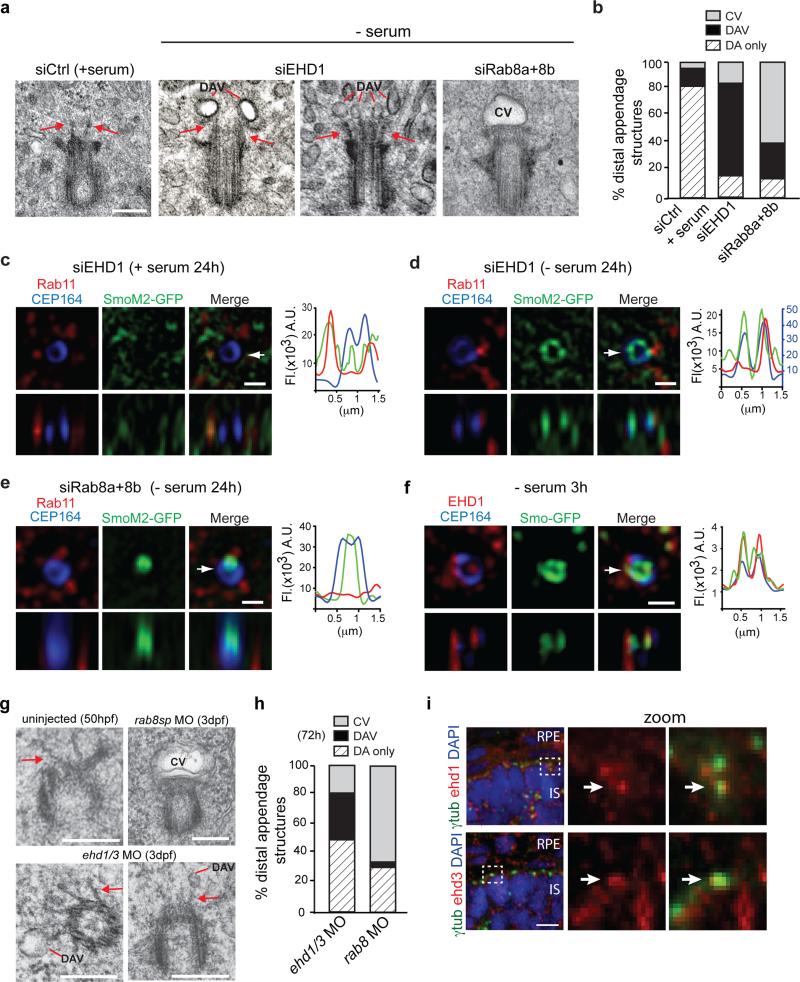
Figure 4. EHD1 functions in ciliary vesicle formation upstream of Rab8.
a. Representative electron micrographs of RPE cell M-centrioles treated with siRNA for 72h, with serum starvation (- serum) the last 24h. Scale bar: 200 nm.
b. Quantification of M-centriole non-cilia distal appendages structures from (a). Pooled data from 2-4 independent experiments (total number of cells counted in all experiments: siControl+serum, 48 cells; siEHD1, 44 cells; siRab8a+8b, 51 cells).
c,d,e. SIM images of RPE SmoM2-GFP cells treated with siRNA as in (a) and stained with Rab11 and CEP164 antibodies. Arrow marks orthogonal view in lower panels and corresponds to fluorescence profile plots. (c) Representative images from 5 random serum fed cells showing no centriolar SmoM2-GFP accumulation. (d) 5 out of 8 cells (63%) showed SmoM2-GFP positive DAV like structures. (e) 5 out of 9 cells (56%) showed CV-like structures. Note that 37.5% of siEHD1 treated cells showed CV-like structures, while 22% of siRab8 depleted cells had DAV-like structures. Profile plots, CEP164 values were normalized by a factor 2 (c) and SmoM2-GFP values were normalized by factor 2 (d). Scale bars: 500 nm.
f. 3h serum starved RPE Smo-GFP cells stained with anti-CEP164 and anti-EHD1 antibodies and imaged by SIM. 7 out of 17 cells (41%) showed distal appendage Smo-GFP co-localization with EHD1. Arrow marks orthogonal view in lower panels and corresponds to fluorescence profile plots. Scale bar: 500 nm.
g. Representative electron micrographs of M-centrioles (MC) from uninjected zebrafish photoreceptor at 50 hpf and 3 dpf photoreceptors injected with ehd1 and ehd3 or rab8sp MO. ehd1 and ehd3 MO were co-injected to maximize depletion of both proteins. Because of high lethality resulting in ehd1 and ehd3 MO, only viable embryos with small eyes were analyzed. Scale bar: 250 nm.
h. Quantification of M-centriole distal appendages structures observed in electron micrographs described in (g). Averages from pooled data across 3 independent experiments (>25 photoreceptors per treatment in total across the experiments).
i. Representative images of M-centrioles in zebrafish photoreceptors at 50hpf stained with anti-Ehd1 or Ehd3 and anti-γ-tubulin antibodies and imaged by spinning disk confocal microscopy. Scale bar: 10 μm.
DAV: Distal appendages vesicles, CV: ciliary vesicle or DA: non-membrane associated distal appendages.

