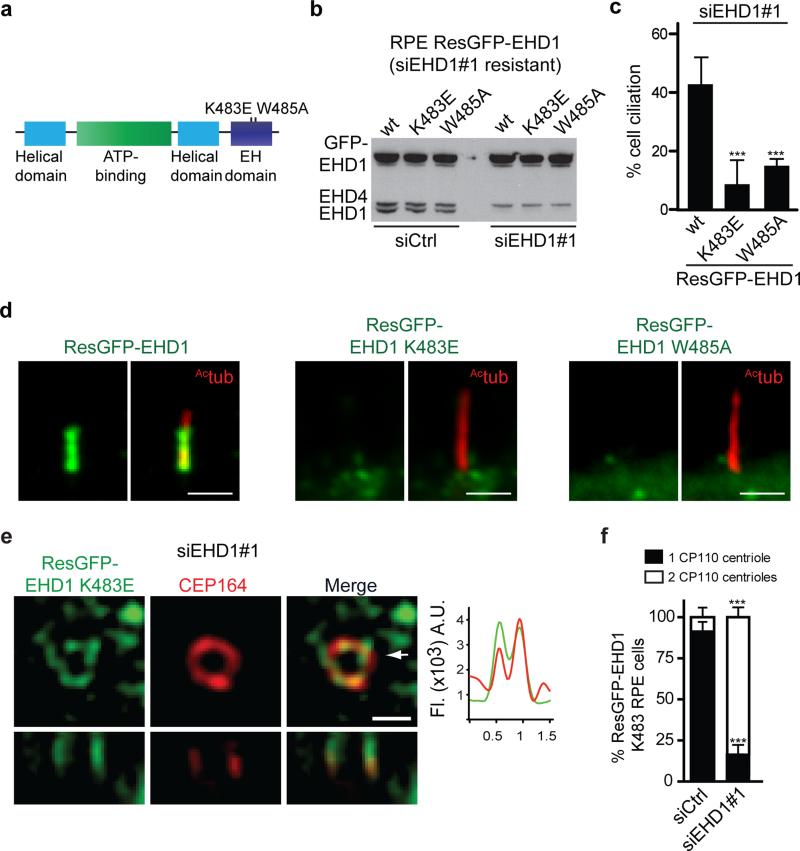
Figure 7. EHD1 tubulation function is required for distal appendages vesicles assembly into the ciliary vesicle.
a. Domain structure of EHD1 and loss of function mutations.
b. Immunoblot analysis of siRNA resistant (Res) GFP-EHD1 wildtype, -K483E and -W485A proteins stably expressed in RPE cells 72h after transfection with siControl or siEHD1#1. Endogenous and GFP-EHD proteins expression levels were detected using anti-EHD1 antibody. Note that the EHD1 antibody also recognizes endogenous EHD4 as indicated. Un-cropped images of blots are shown in Supplementary Fig 6.
c. Quantification of cilia in cells treated with siEHD1#1 as described in (b) and serum starved the last 24h. Means ± SD are pooled data from 3 independent experiments with n=8 areas imaged (total number of cells from all experiments: ResGFP-EHD1, 293; ResGFP-EHD1 K483E, 269; ResGFP-EHD1 W485A, 263).Two tailed t-test analysis compared with WT.
d. Cell lines described in (b) were serum starved for 24h and stained with Actub antibody to mark the cilia. Scale bar: 2 μm.
e. Representative SIM image of RPE cells expressing the siRNA resistant GFP-K483E mutant transfected with EHD1 siRNA as in (c) and stained with CEP164 antibody. 9 out of 15 cells (60%) imaged expressing the K483E showed DAV-like structures. Arrow marks orthogonal view (bottom panels) and corresponds to fluorescence profile plots. Scale bar: 500nm.
f. Quantification of CP110 localization on the mother and daughter centrioles in RPE cells treated as in (c) and stained as described in Fig 6b. Means ± SD are pooled data from 3 independent experiments with n=6 areas imaged (total number of cells from all experiments: siCtrl, 148; siEHD1#1, 114). Two tailed t-tests compared with siCtrl.
*** P<0.0001. Statistics source data for Fig7 c,f can be found in Supplementary Table 2.

