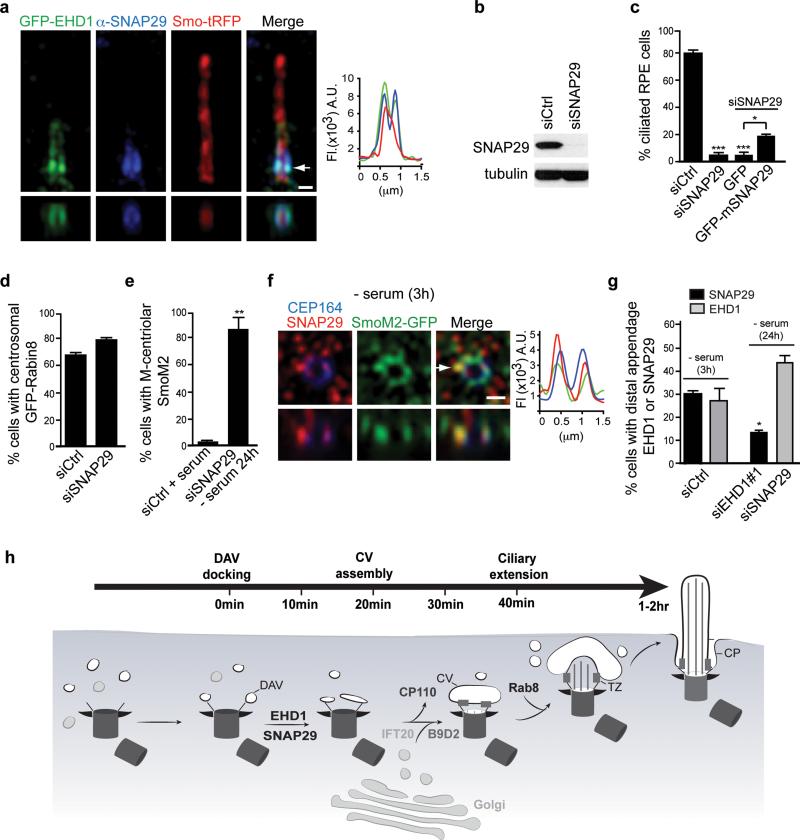
Figure 8. SNAP29, a SNARE and EHD1 and EHD3 binding protein, functions in CV assembly.
a. SIM image of RPE cells expressing Smo-tRFP and GFP-EHD1 stained with anti-SNAP29 antibody. Arrow corresponds to orthogonal view (bottom panels) and fluorescence intensity plot. Representative image of > 10 cells. Scale bar: 500 nm.
b. Western analysis of SNAP29 depletion in RPE cells treated for 72h. Un-cropped blots are shown in Supplementary Fig 6.
c. Quantification of ciliogenesis in RPE cells treated with siRNA for 72h (- serum the last 24h) with and without expression of GFP or GFP-mSnap29, stained with Actub and PCNT antibodies. Not included in the plot are short cilia (<1 μm) detected in 44 ± 2.4% in mSNAP29-positive cells. Mean ± SEM from n=3 independent experiments (>150 cells per treatment).
d. Quantification of RPE GFP-Rabin8 cells transfected with siRNAs for 72h and imaged live for centrosomal GFP-Rabin8 accumulation after 1hr starvation. Mean ± SEM from n=3 independent experiments (>150 cells per treatment).
e. Quantification of SmoM2-GFP at the M-centriole in RPE cells treated as described in (c) and stained with CEP164 antibodies. Mean ± SEM from n=3 independent experiments (>150 cells per treatment).
f. Representative SIM image of RPE SmoM2-GFP cells serum starved for 3h and stained with SNAP29 and CEP164 antibodies. 6 out of 14 cells (42%) showed SNAP29 co-localization with Smo-GFP at the distal appendages. Arrow corresponds to orthogonal view (bottom panels) and fluorescence intensity plot. Scale bars: 500nm.
g. Quantification of EHD1 and SNAP29 M-centriolar accumulation in RPE cells treated with siRNAs for 48h followed by 24h or 3h (siControl) serum starvation, and stained with CEP164 and EHD1 or SNAP29 antibodies. Mean ± SEM from n=3 independent experiments is shown (total number of cells counted in all experiments: siCtrl SNAP29, 234; siCtrl EHD1, 215: siEHD1#1, 116, siSNAP29, 149). Two tailed t-test analysis compared with siCtrl.
h. Model of intracellular ciliogenesis and time-line for the accumulation of ciliogenesis proteins at the M-centriole and developing cilia.
Two tailed t-test analyses compared with siCtrl or GFP Figure 8c,d,e.* P<0.05, ** P<0.001. Statistics source data for Fig 8c-e,g can be found in Supplementary Table 2.

