
Figure 3.
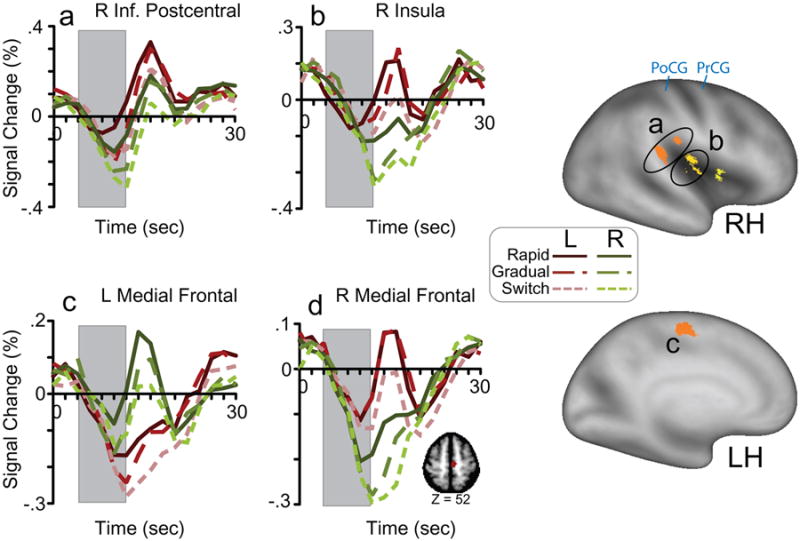
ROIs with a significant interaction of both Rate of Evidence x time and Response Hand x time over time points 3-7 (Table 3). On the right side, ROIs are projected onto lateral (top right) and medial (bottom right) inflated cortical surfaces using Caret software (Van Essen et al., 2001) and the PALS-B12 atlas (Van Essen, 2005). Different ROIs are indicated by different shades. Time series data from three of the ROIs are shown in a-c, beginning at trial onset (time 0 sec). Time points 3-7 are indicated by a gray rectangle. a) right inferior postcentral gyrus b) right posterior insula c) left medial frontal gyrus d) The right hemisphere homologue of the left medial frontal ROI. The inset shows the region at Talairach z-coordinate = 52. PrCG = precentral gyrus; PoCG = postcentral gyrus; L = left hand response; R = right hand response; RH = right hemisphere; LH = left hemisphere.