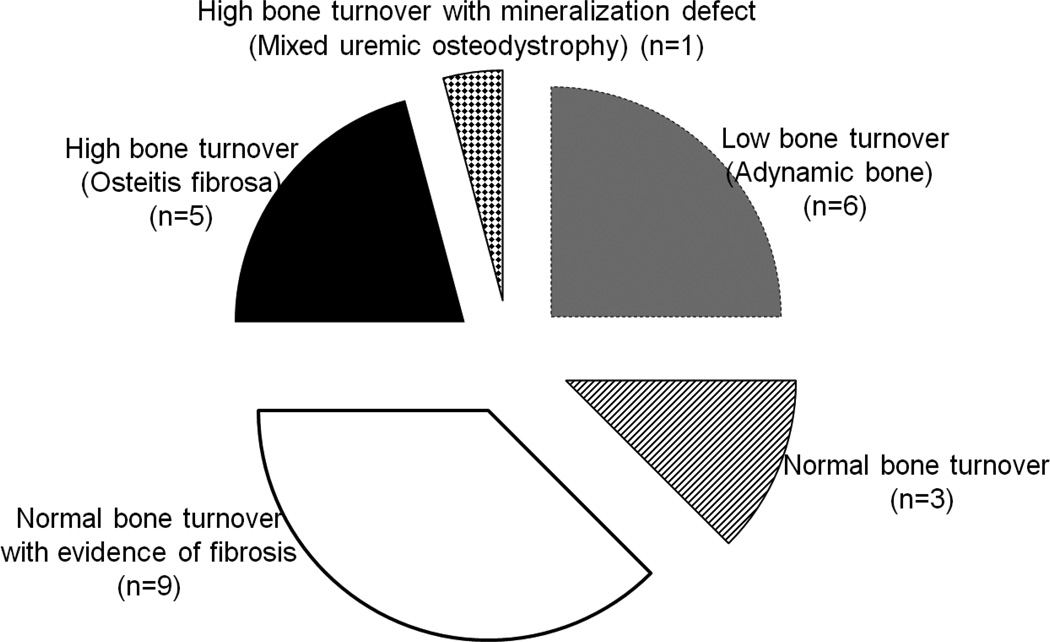
Figure 1.
Lesions of renal osteodystophy on bone biopsy represented in the cohort of ESKD patients evaluated for osteoblast-like cell and bone core RNA. Adynamic bone (low bone turnover) (grey): n=6; normal bone turnover (striped): n=3; normal bone turnover with fibrosis (white): n=9; osteitis fibrosa (high bone turnover) (black): n=5; mixed uremic osteodystrophy (high bone turnover with defective mineralization) (checkered): n=1.

