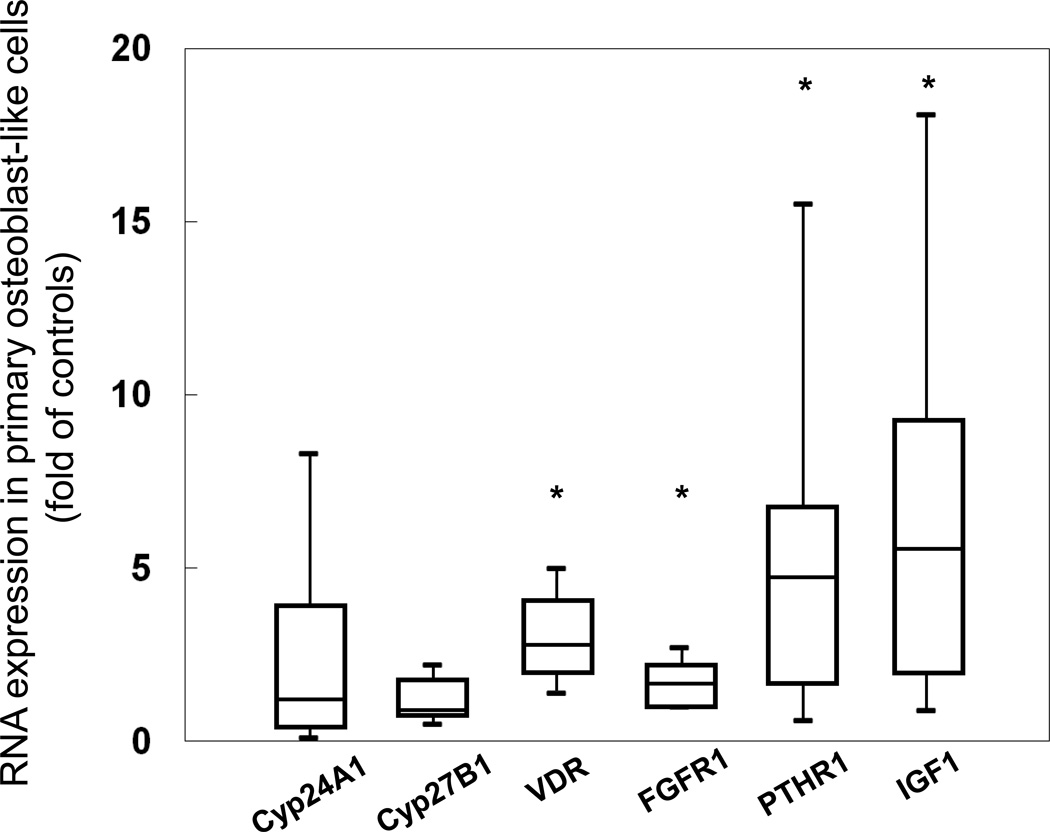
Figure 4.
Gene expression of cell signaling genes in primary osteoblasts from CKD patients. Values are expressed as a multiple of (fold of) the expression found in normal control cells. Box plots indicate the medians (interquartile ranges); the 5th and 95th percentiles are denoted by the lower and upper whiskers, respectively. The asterisks denote significant (p<0.001) differences from healthy controls.

