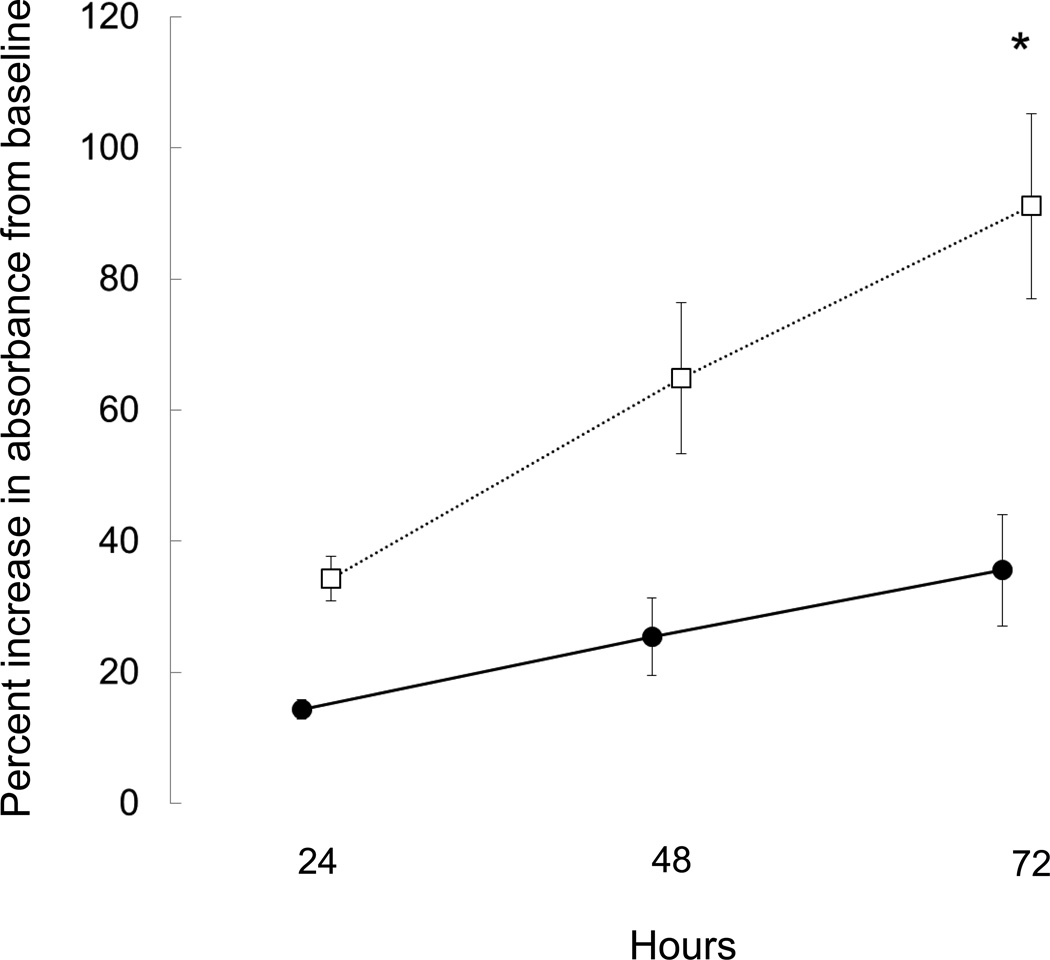
Figure 6.
Proliferation of primary human osteoblast-like cells as assessed by MTS incorporation. Data are expressed as percentage increase in absorbance from baseline. A higher proliferation rate was observed in dialysis patients with high turnover renal osteodystrophy (open symbols) than in controls (closed symbols) (p<0.01). The asterisk denotes a significant (p<0.01) difference in proliferation rates between groups.

