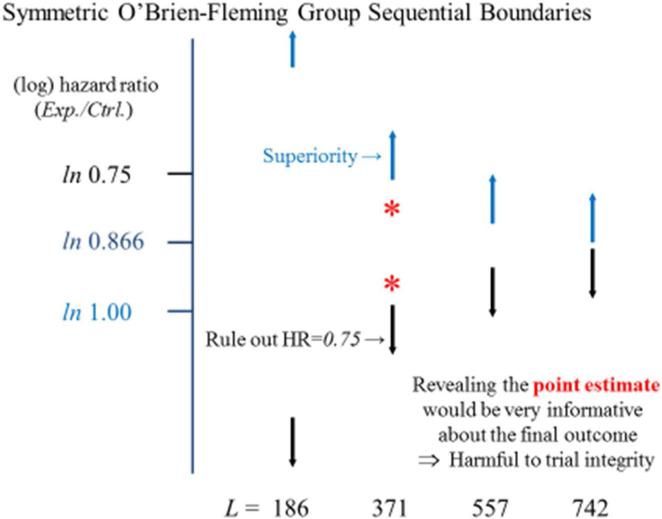
Figure #2.
The Normal Hematocrit Trial was designed to evaluate the rates of death/MI events on a high dose relative to a standard dose regimen of an erythropoietin stimulating agent. The figure presents a monitoring boundary for superiority (in blue), ruling out the null hypothesis of a 1.00 hazard ratio, and a monitoring boundary to rule out a 0.75 hazard ratio (in black), when analyses are conducted after equal increments in the occurrence of the trial's planned 742 death/MI events. L denotes the number of events available at each analysis. The orange asterisks illustrate estimates for the hazard ratio that could be obtained at the mid-point of the trial.

