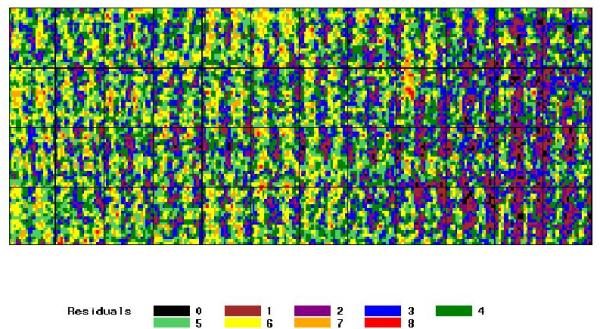
Figure 1.

Spatial distribution of the signal for the self-hybridized Arabidopsis slide Each pixel represents the uncorrected log-ratio of the median Cy5 (635 nm) and Cy3 (532 nm) channel fluorescence measurements, associated to a printed DNA feature. Background is not represented. The picture is not a re-plot of the original image captured during the scanning process. Labels correspond to the 9-quantiles of the signal distribution.
