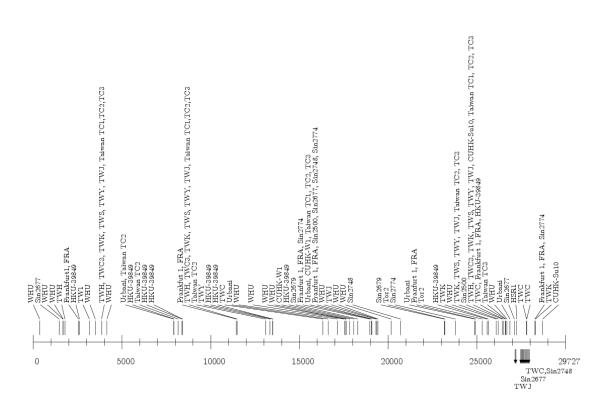
Figure 5.

Density distribution of SNPs, insertions and deletions in the isolates of A1 group. SNPs are represented above the line, insertions below the line, upward oriented, and deletions below the line, downward oriented. The TWH scale is used. The same holds for Figures 6,7,8.
