Figure 6.

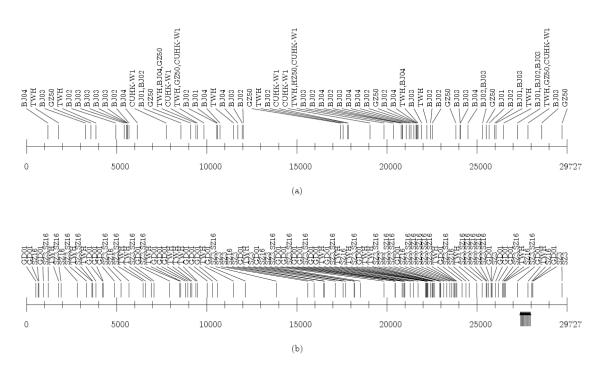
(a and b). Density distribution of SNPs, insertions and deletions in the isolates of A2 and B groups. In A2 group there are no insertions / deletions. In B group there are large insertions in GD01, SZ3 and SZ16 isolates.

(a and b). Density distribution of SNPs, insertions and deletions in the isolates of A2 and B groups. In A2 group there are no insertions / deletions. In B group there are large insertions in GD01, SZ3 and SZ16 isolates.