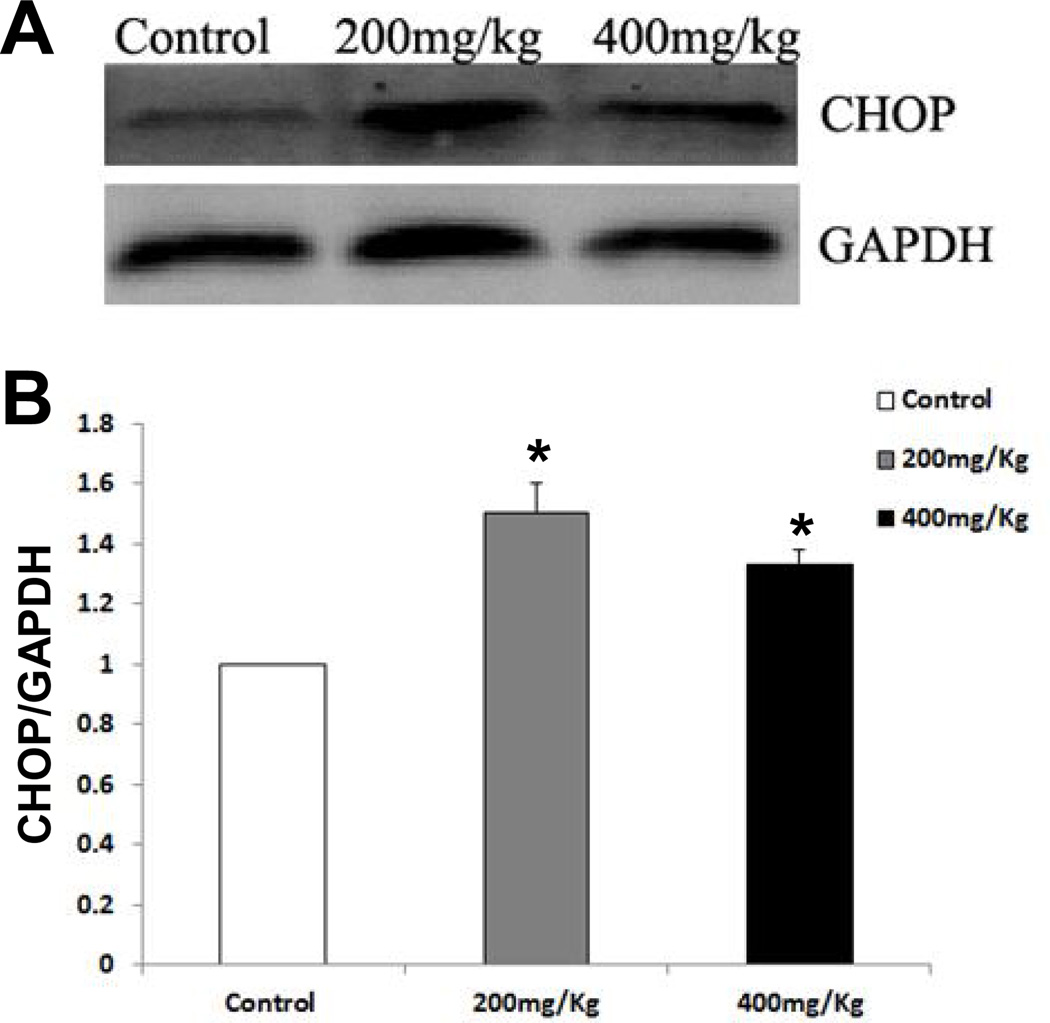
Fig. 7. Western blot analysis for CHOP protein in the livers of mice treated with Nano-ZnO.
Mice were orally administrated physiological saline (control), 200 mg/kg, or 400 mg/kg of Nano-ZnO for 90 consecutive days. The protein expression level of CHOP was determined in mouse liver homogenates by Western blot. A is a representative Western blot result, while B shows average band densities normalized with GAPDH. Values are expressed as mean ± SD (n=6–8). * p<0.05 vs. control.

