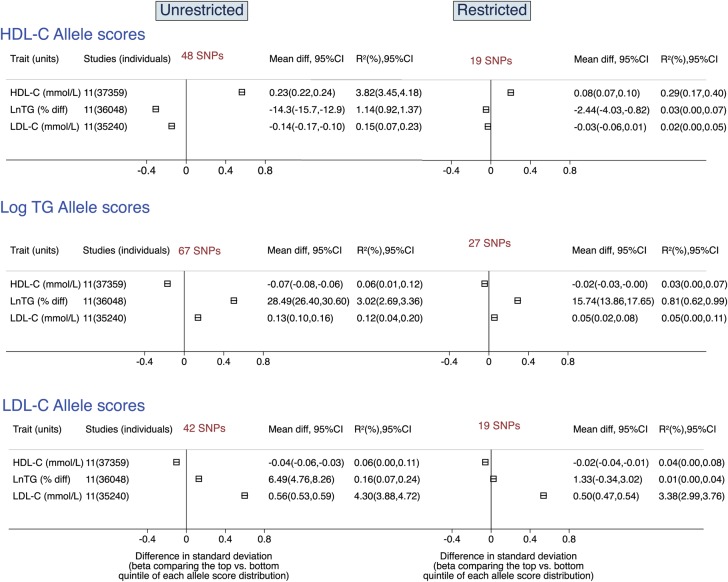
Figure 1.
Meta-analysis pooled estimates of the association of the unrestricted and restricted allele scores with target and non-target lipid traits. Estimates were obtained from prospective cohorts genotyped using the ITMAT Broad Institute CARe consortium CardioChip array (detailed in Supplementary material online, Table S1). A lower limit of 0 was imposed on the R2 values. Mean diff, mean difference comparing top to bottom quintile of each allele score. R2 = proportion of variable of the lipid traits explained by each allele score. TG, triglycerides.

