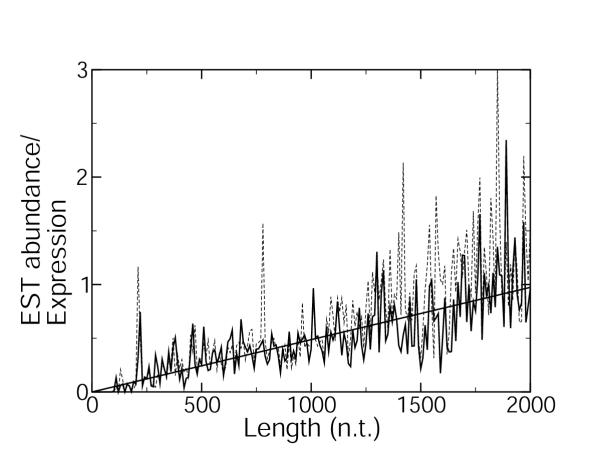
Figure 4.
The length bias The length bias, calculated as the ratio of abundance within the EST database [22] to microarray expression data [24,25] for each gene present in both datasets, is shown (solid curve). A linear fit to the length bias is shown (solid line). Also shown is the length bias when all of the C. elegans EST data from WormBase [30,31] are used to calculate the EST abundance (dashed curve).

