
Figure 9.
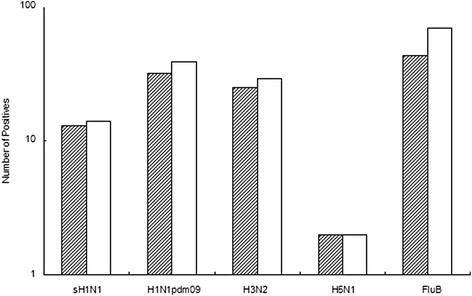
Comparison of DPO PCR and qPCR positive samples for sH1N1, H1N1pdm09, H3N2, H5N1 and FluB. Shaded bars represent the number of positive samples detected by DPO PCR; clear bars represent qPCR positive samples.
Official websites use .gov
A
.gov website belongs to an official
government organization in the United States.
Secure .gov websites use HTTPS
A lock (
) or https:// means you've safely
connected to the .gov website. Share sensitive
information only on official, secure websites.
Comparison of DPO PCR and qPCR positive samples for sH1N1, H1N1pdm09, H3N2, H5N1 and FluB. Shaded bars represent the number of positive samples detected by DPO PCR; clear bars represent qPCR positive samples.