
Figure 4.
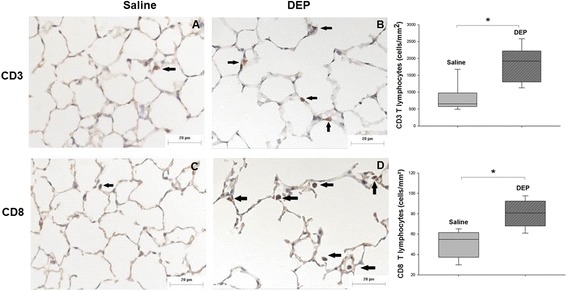
CD3+ and CD8+ T cells density in lung parenchyma in saline or DEP exposed mice. Photomicrography of mice lung parenchyma showing CD3+ (A,B) and CD8+ T cells (C, D) in saline (A, C) and DEP group (B, D). Observe the increased density of these cells in the DEP group. Scale bar = 20 μm. The graphs show expression of CD3+ T lymphocytes and CD8+ T lymphocytes in saline and DEP group. The median is represented as horizontal bars. CD3+ T lymphocytes: *p ≤ 0.001 compared with saline group. CD8+ T lymphocytes: *p ≤ 0.001 compared with saline group.