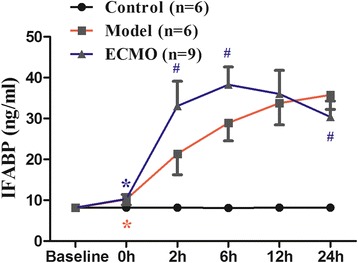
Figure 1.

Effect of ECMO therapy on IFABP in serum in different time points. Value are ex pressed as mean+/− SD of each group. Compared with control group, *p < 0.05, compared with Molde group, #p < 0.05.

Effect of ECMO therapy on IFABP in serum in different time points. Value are ex pressed as mean+/− SD of each group. Compared with control group, *p < 0.05, compared with Molde group, #p < 0.05.