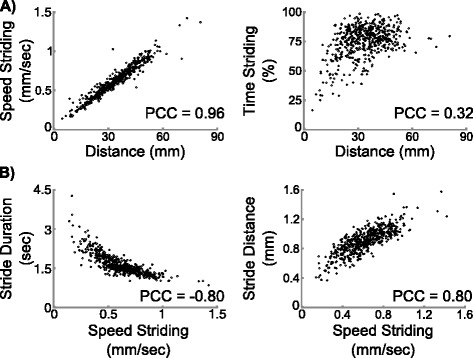
Figure 3.

Correlation of parameters. A) Scatter plots showing that distance travelled is more correlated with speed striding than time striding. B) Scatter plots showing that speed striding is negatively correlated to the duration of one stride and positively correlated to the distance of one stride. PCC, Pearson correlation coefficient.
