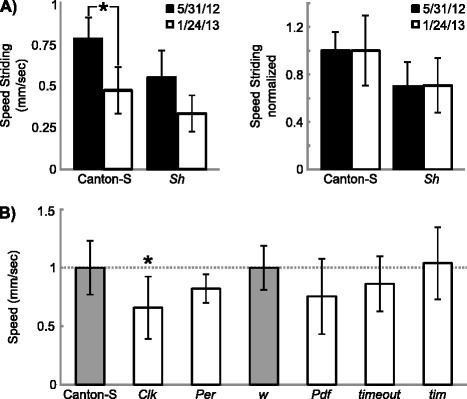
Figure 5.

Use MaggotTracker to examine effects of circadian genes on speed. A) Left, striding speed of Canton-S and Sh animals measured in two experiments (5/31/12 and 1/24/13). Right, striding speed normalized using same-day-tracked Canton-S animals. n ≥ 9 animals for each genotype in each experiment. *, p < 0.001, student’s t-test. B) Normalized speed values from mutants of multiple circadian genes. Gray bars, control groups. White bars, test mutant groups. n ≥ 11 animals for each genotype. *, p < 0.001 between control and mutant groups using one-way ANOVA and Scheffe post hoc test. Bars and error bars are means and standard deviations.
