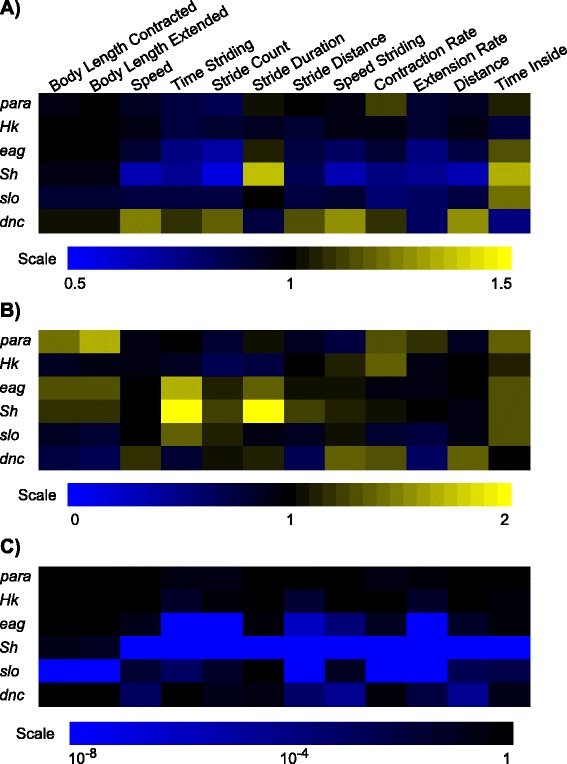
Figure 6.

Use MaggotTracker for phenotypic profiling. Heat maps showing normalized means (A), normalized standard deviations (B), and p values (C) for 12 locomotive parameters from six mutants. Normalized means in (A) were calculated using mutant means divided by control means. Normalized standard deviations in (B) were calculated using mutant standard deviations divided by control standard deviations. In (A) and (B), black (normalized value of 1) indicates the same value as control; blue and yellow indicate lower and higher than control values, respectively. In (C), p values were computed between the control and the mutant groups using one-way ANOVA and Scheffe post hoc test. n ≥ 20 animals for each genotype. Heat map scales were generated using rounded minimum and maximum values and splitting the range into 33 colors.
