Figure 3.

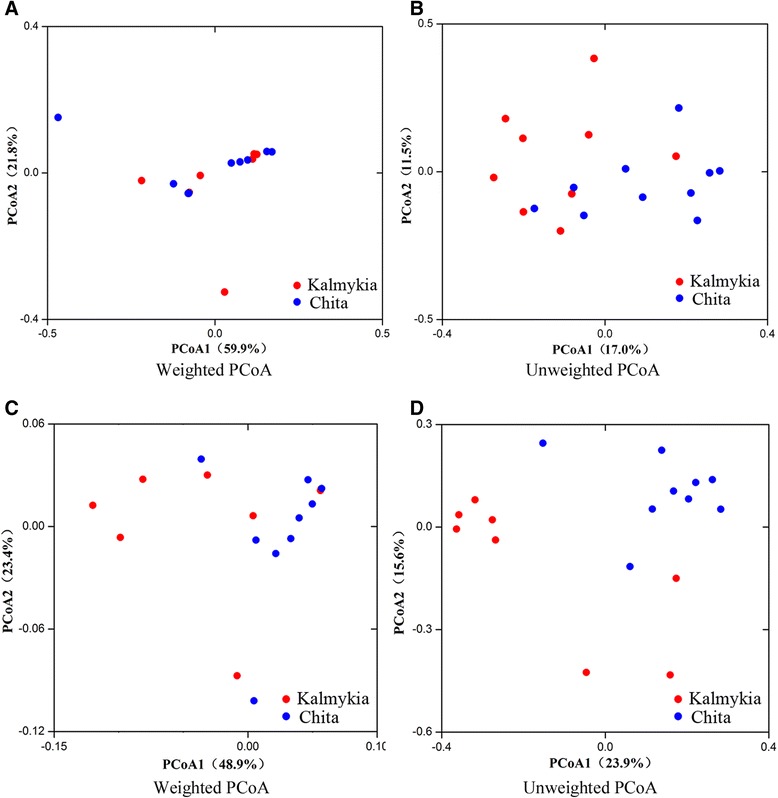
UniFrac principal coordinate analysis of the bacterial (A, B) and fungal (C, D) communities in the NFCM samples. Red and blue symbols represent samples from Kalmykia and Chita, respectively.

UniFrac principal coordinate analysis of the bacterial (A, B) and fungal (C, D) communities in the NFCM samples. Red and blue symbols represent samples from Kalmykia and Chita, respectively.