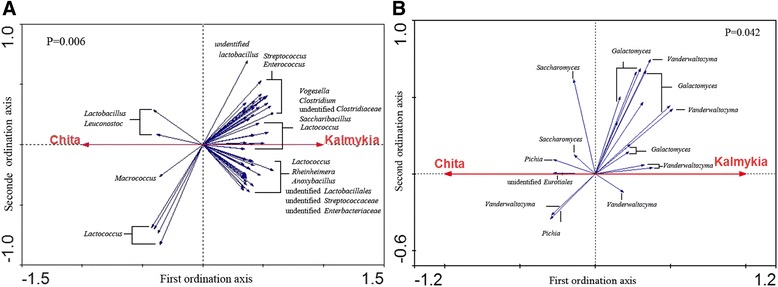
Figure 4.

Biplot of redundancy analysis (RDA) of the bacteria (A) and fungi (B) in the NFCM from Chita and Kalmykia. Red arrows represent the constrained explanatory variables, Kalmykia and Chita. Blue arrows represent the response variables with the first ordination axis explaining respectively for at least 8.6% and 1.8% of the variability of the bacterial and fungal microbiota. The p-values generated from the Monte Carlo Permutation Test are included in the plots.
