
. 2015 Feb 25;15:83. doi: 10.1186/s12885-015-1071-x
© Li et al.; licensee BioMed Central. 2015
This article is published under license to BioMed Central Ltd. This is an Open Access article distributed under the terms of the Creative Commons Attribution License (http://creativecommons.org/licenses/by/4.0), which permits unrestricted use, distribution, and reproduction in any medium, provided the original work is properly credited. The Creative Commons Public Domain Dedication waiver (http://creativecommons.org/publicdomain/zero/1.0/) applies to the data made available in this article, unless otherwise stated.
Figure 2.
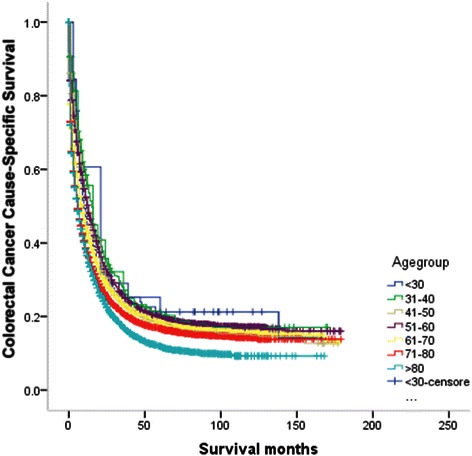
Survival curves according to each age subgroups in colorectal patients in non-operated group.