
Figure 4.
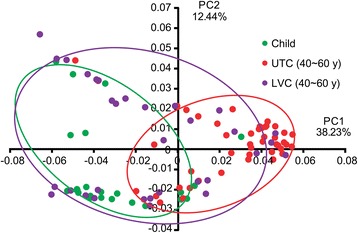
Principal coordinate analysis plot. The plot shows the clustering pattern between UTC and LVC based on a Principal Coordinates Analysis (PCoA). The distance matrix was calculated using weighted pairwise Fast UniFrac. LVC, longevity village communities; UTC, urbanized town communities. Green circle, child; red circle, UTC 40–69 y; purple circle, LVC 40–69 y.