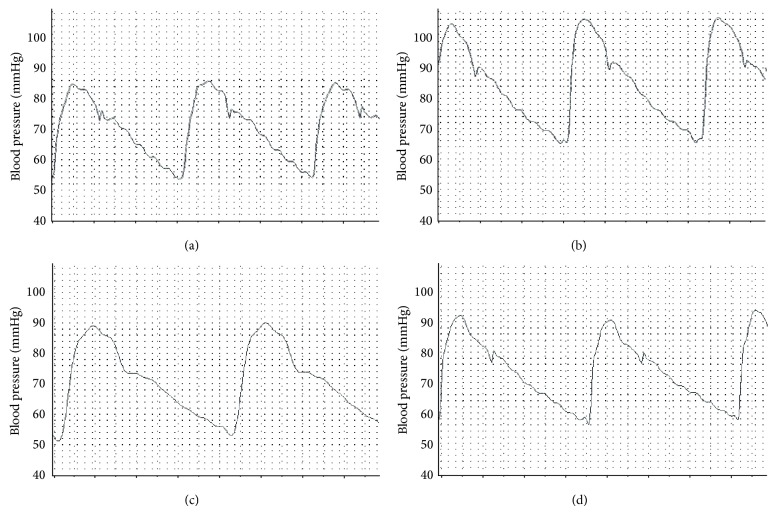
Figure 2.
The effect of allopurinol on insulin resistance induced blood pressure changes in BP tracing. Normal control BP (a) shows control systolic and diastolic pressure. IR BP tracing (b) shows increase of both systolic and diastolic BP. IR + allopurinol (c) shows nearly normalized diastolic BP with significant decrease of the elevated systolic BP and increase in the diastolic time. Control + allopurinol (d) shows nearly normal systolic and diastolic BP with minimal increased diastolic time.

