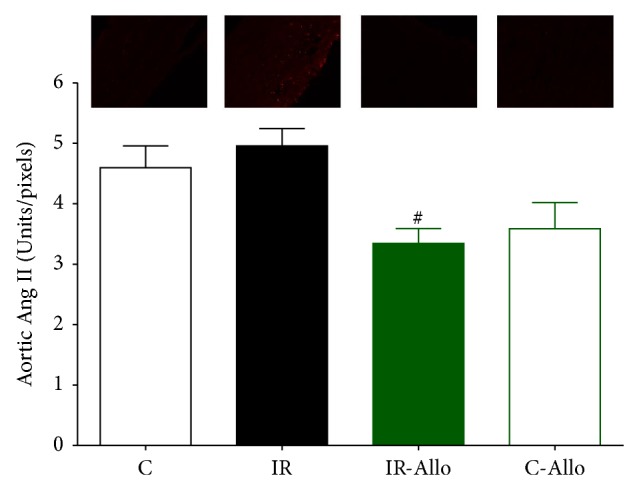
Figure 6.

The effect of allopurinol (Allo) treatment on insulin resistance (IR) induced Ang II changes, measured in Units/pixels. Values are expressed as the mean ± SEM; N = 6–8 animals; * P < 0.05, compared with the corresponding control group values; # P < 0.05 compared with the corresponding IR group values, by One-Way ANOVA and Newman-Keuls post hoc test.
