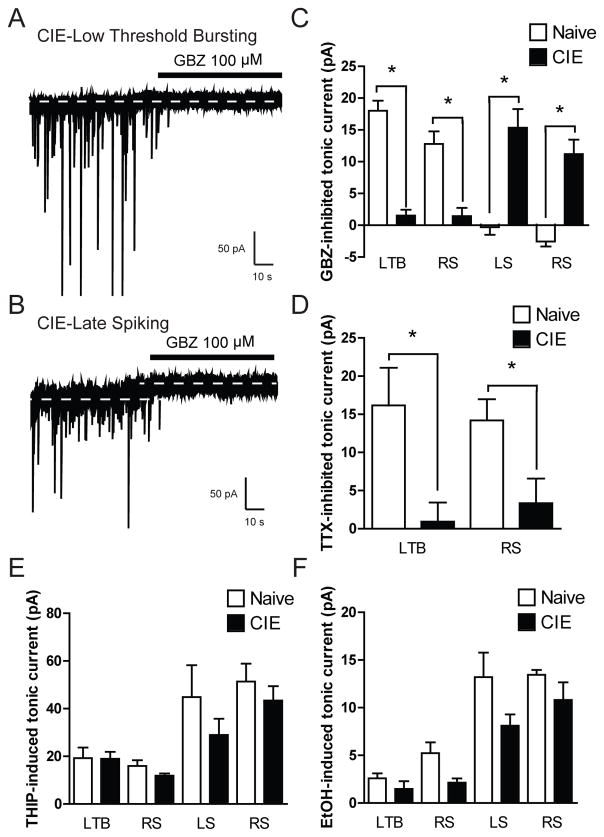
Figure 7.
A. Representative voltage-clamp recording of a Low Threshold Bursting (LTB) CeA neuron from a chronic intermittent ethanol (CIE) exposed rat during focal application of gabazine (GBZ, 100 μM). Dashed lines indicate average holding current. B. Representative voltage-clamp recording of a Late Spiking (LS) CeA neuron from a CIE exposed rat during focal application of gabazine (GBZ, 100 μM). Dashed lines indicate average holding current. C. Summary of the tonic current in LTB and RS CeA neurons from naïve and CIE exposed rats revealed by focal application of GBZ [n = 13 (naïve LTB), n = 10 (CIE LTB); n = 5 (naïve RS), n = 5 (CIE RS); n = 6 (naïve LS), n = 5 (CIE LS); n = 7 (naïve RS), n = 6 (CIE RS)] *p<0.05 by one-way ANOVA with Bonferroni post hoc comparison. D. Summary of the tonic current by cell type in CeA neurons from naïve and CIE exposed rats revealed by superfusion of tetrodotoxin [TTX, 1 μM; n = 6 (naïve LTB), n = 6 (CIE LTB); n = 7 (naïve RS), n = 4 (CIE RS)] *p<0.05 by one-way ANOVA with Bonferroni post hoc comparison. E. Summary of the tonic current by cell type in CeA neurons from naïve and CIE exposed rats revealed by focal application of 5 μm THIP [n = 5 (naïve LTB), n = 12 (CIE LTB); n = 7 (naïve RS), n = 9 (CIE RS); n = 7 (naïve LS), n = 6 (CIE LS); n = 9 (naïve RS), n = 6 (CIE RS)] *p<0.05 by one-way ANOVA with Bonferroni post hoc comparison. F. Summary of the tonic current by cell type in CeA neurons from naïve and CIE exposed rats produced by focal application of ethanol (EtOH 44 nM) [n = 6 (naïve LTB), n = 12 (CIE LTB); n = 6 (naïve RS), n = 8 (CIE RS); n = 6 (naïve LS), n = 4 (CIE LS); n = 5 (naïve RS), n= 6 (CIE RS)] *p<0.05 by one-way ANOVA with Bonferroni post hoc comparison.

