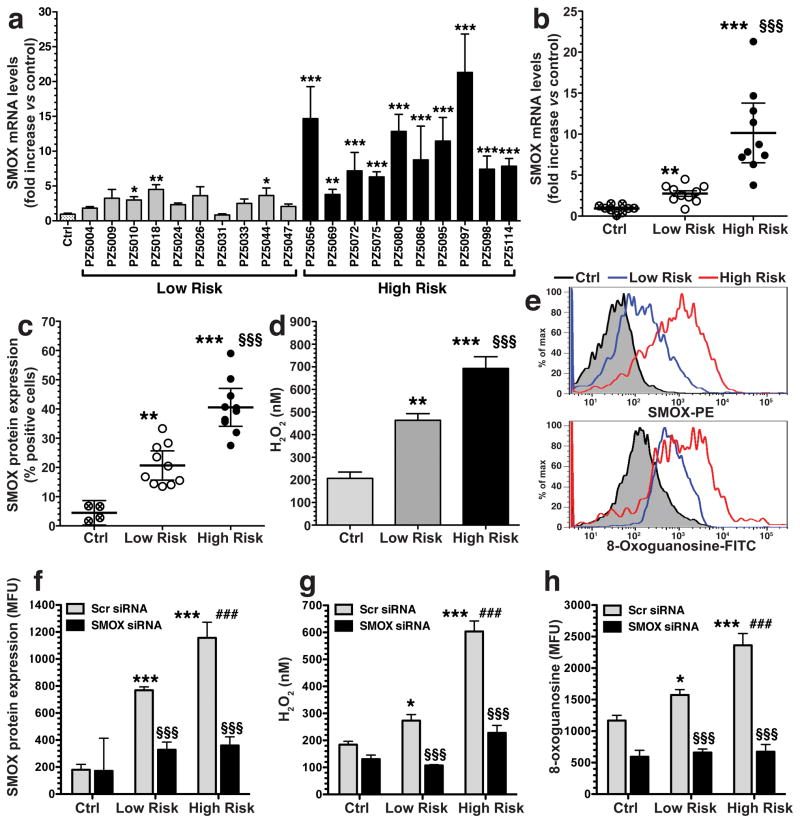
Figure 1.
Clinical isolates from the high risk region of Colombia induce higher levels of SMOX expression, H2O2, and DNA damage. AGS cells were co-cultured with clinical isolates from the low and high risk regions. (a and b) After 6 h, levels of SMOX mRNA were measured by real-time PCR. (c) Percentage of SMOXhigh (SMOX-positive) cells after 24 h co-culture, assessed by flow cytometry. (d) Levels of H2O2 in cell culture supernatants after 24 h by Amplex Red assay. (e) Representative histograms for SMOX and 8-oxoguanosine. (f–h) Cells were transfected with scrambled (Scr) siRNA or SMO siRNA and activated with strains from each risk region for 24 h, and summary data is shown. (f) SMOX protein levels in mean fluorescence units assessed by flow cytometry. (g) Levels of H2O2 in cell culture supernatants. (h) DNA damage measured by flow cytometry for 8-oxoguanosine levels. In a-h, data is from at least three experiments in duplicate. For a-d, *P < 0.05, **P < 0.01, ***P < 0.001 versus control (Ctrl); §§§P < .001 versus low risk. For f–h, *P < .05, ***P < 0.001 versus Scr control; §§§P < 0.001 versus Scr low risk or Scr high risk. ###P < 0.001 versus Scr low risk. For a, b, c, and e, 10 strains from each region were used; for d, 7 strains from each region were used, and for f–h, 4 strains from each region were used.

